Note
Click here to download the full example code
2.4.4. Examples of design matrices
Three examples of design matrices specification and computation for first-level fMRI data analysis (event-related design, block design, FIR design).
This examples requires matplotlib.
try:
    import matplotlib.pyplot as plt
except ImportError:
    raise RuntimeError("This script needs the matplotlib library")
2.4.4.1. Define parameters
At first, we define parameters related to the images acquisition.
Then we define parameters related to the experimental design.
# these are the types of the different trials
conditions = ['c0', 'c0', 'c0', 'c1', 'c1', 'c1', 'c3', 'c3', 'c3']
duration = [1., 1., 1., 1., 1., 1., 1., 1., 1.]
# these are the corresponding onset times
onsets = [30., 70., 100., 10., 30., 90., 30., 40., 60.]
# Next, we simulate 6 motion parameters jointly observed with fMRI acquisitions
motion = np.cumsum(np.random.randn(n_scans, 6), 0)
# The 6 parameters correspond to three translations and three
# rotations describing rigid body motion
add_reg_names = ['tx', 'ty', 'tz', 'rx', 'ry', 'rz']
2.4.4.2. Create design matrices
The same parameters allow us to obtain a variety of design matrices. We first create an events object.
import pandas as pd
events = pd.DataFrame({'trial_type': conditions, 'onset': onsets,
                         'duration': duration})
We sample the events into a design matrix, also including additional regressors.
hrf_model = 'glover'
from nistats.design_matrix import make_first_level_design_matrix
X1 = make_first_level_design_matrix(
    frame_times, events, drift_model='polynomial', drift_order=3,
    add_regs=motion, add_reg_names=add_reg_names, hrf_model=hrf_model)
Now we compute a block design matrix. We add duration to create the blocks. For this we first define an event structure that includes the duration parameter.
duration = 7. * np.ones(len(conditions))
events = pd.DataFrame({'trial_type': conditions, 'onset': onsets,
                         'duration': duration})
Then we sample the design matrix.
X2 = make_first_level_design_matrix(frame_times, events, drift_model='polynomial',
                                    drift_order=3, hrf_model=hrf_model)
Finally we compute a FIR model
events = pd.DataFrame({'trial_type': conditions, 'onset': onsets,
                         'duration': duration})
hrf_model = 'FIR'
X3 = make_first_level_design_matrix(frame_times, events, hrf_model='fir',
                                    drift_model='polynomial', drift_order=3,
                                    fir_delays=np.arange(1, 6))
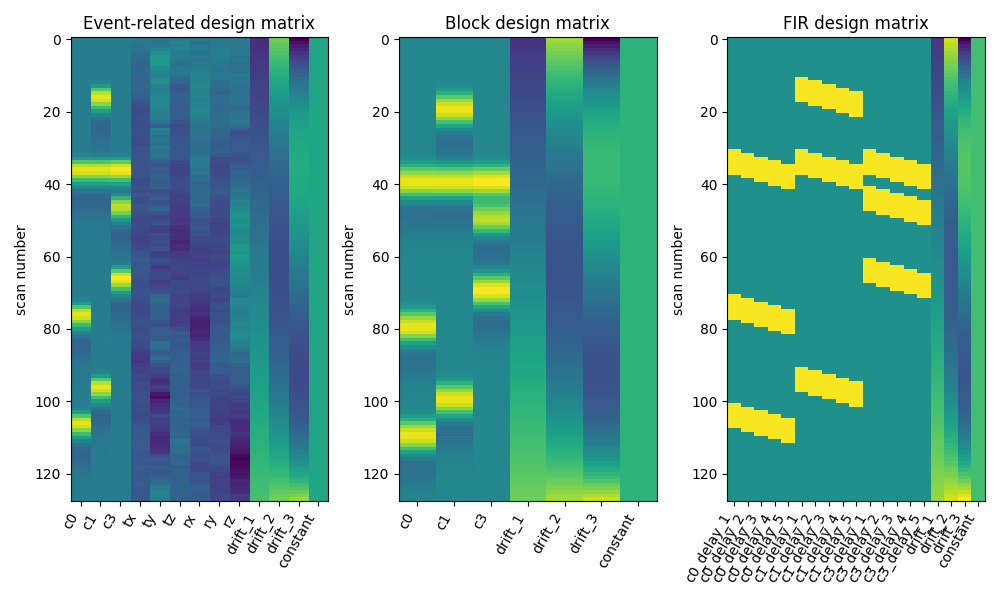
Here are the three designs side by side.
from nistats.reporting import plot_design_matrix
fig, (ax1, ax2, ax3) = plt.subplots(figsize=(10, 6), nrows=1, ncols=3)
plot_design_matrix(X1, ax=ax1)
ax1.set_title('Event-related design matrix', fontsize=12)
plot_design_matrix(X2, ax=ax2)
ax2.set_title('Block design matrix', fontsize=12)
plot_design_matrix(X3, ax=ax3)
ax3.set_title('FIR design matrix', fontsize=12)
Out:
Text(0.5, 1.0, 'FIR design matrix')
Let’s improve the layout and show the result.
plt.subplots_adjust(left=0.08, top=0.9, bottom=0.21, right=0.96, wspace=0.3)
plt.show()

Out:
/home/kshitij/workspace/nistats-org/nistats-repo/nistats-kchawla-pi/examples/04_low_level_functions/plot_design_matrix.py:92: UserWarning: Matplotlib is currently using agg, which is a non-GUI backend, so cannot show the figure.
  plt.show()
Total running time of the script: ( 0 minutes 0.409 seconds)