Note
Click here to download the full example code
2.4.2. Example of hemodynamic reponse functions.
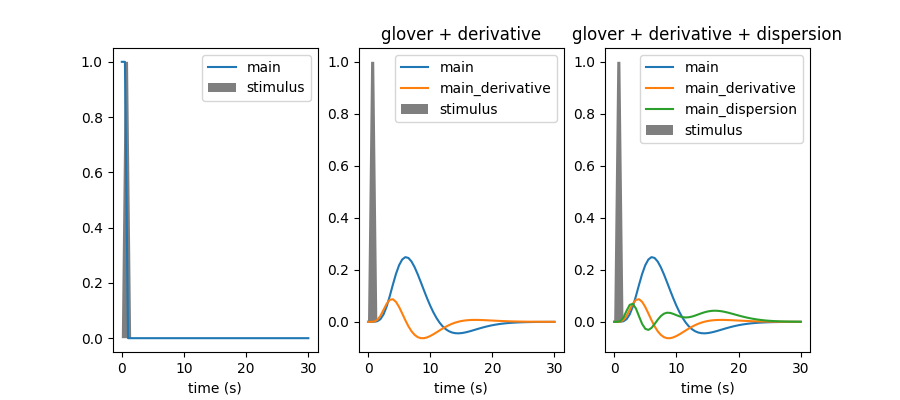
Within this example we are going to plot the hemodynamic reponse function (hrf) model in SPM together with the hrf shape proposed by G.Glover, as well as their time and dispersion derivatives.
This example requires matplotlib.
The hrf is the filter that couples neural responses to the metabolic-related changes in the MRI signal. hrf models are simply phenomenological.
In current analysis frameworks, the choice of hrf model is essentially left to the user. Fortunately, using the spm or Glover model does not make a huge difference. Adding derivatives should be considered whenever timing information has some degree of uncertainty. It is actually useful to detect timing issues.
2.4.2.1. Set up some parameters for model display
To get an impulse reponse, we simulate a single event occurring at time t=0, with duration 1s.
import numpy as np
frame_times = np.linspace(0, 30, 61)
onset, amplitude, duration = 0., 1., 1.
exp_condition = np.array((onset, duration, amplitude)).reshape(3, 1)
We sample this on a fris for display
stim = np.zeros_like(frame_times)
stim[(frame_times > onset) * (frame_times <= onset + duration)] = amplitude
Now we have to define the candidate hrf models.
hrf_models = [None, 'glover + derivative', 'glover + derivative + dispersion']
2.4.2.2. Sample the hrf
from nistats import hemodynamic_models
import matplotlib.pyplot as plt

fig = plt.figure(figsize=(9, 4))
for i, hrf_model in enumerate(hrf_models):
    # obtain the signal of interest by convolution
    signal, name = hemodynamic_models.compute_regressor(
        exp_condition, hrf_model, frame_times, con_id='main',
        oversampling=16)

    # plot this
    plt.subplot(1, 3, i + 1)
    plt.fill(frame_times, stim, 'k', alpha=.5, label='stimulus')
    for j in range(signal.shape[1]):
        plt.plot(frame_times, signal.T[j], label=name[j])
    plt.xlabel('time (s)')
    plt.legend(loc=1)
    plt.title(hrf_model)

# adjust the plot
plt.subplots_adjust(bottom=.12)
plt.show()
Out:
/home/kshitij/workspace/nistats-org/nistats-repo/nistats-kchawla-pi/examples/04_low_level_functions/plot_hrf.py:64: UserWarning: Matplotlib is currently using agg, which is a non-GUI backend, so cannot show the figure.
  plt.show()
Total running time of the script: ( 0 minutes 0.144 seconds)