Note
Click here to download the full example code
2.4.1. Example of second level design matrix
This example shows how a second-level design matrix is specified: assuming that the data refer to a group of individuals, with one image per subject, the design matrix typically holds the characteristics of each individual.
This is used in a second-level analysis to assess the impact of these characteristics on brain signals.
This example requires matplotlib.
try:
    import matplotlib.pyplot as plt
except ImportError:
    raise RuntimeError("This script needs the matplotlib library")
2.4.1.1. Create a simple experimental paradigm
We want to get the group result of a contrast for 20 subjects.
n_subjects = 20
subjects_label = ['sub-%02d' % i for i in range(1, n_subjects + 1)]
Next, we specify extra information about the subjects to create confounders. Without confounders the design matrix would correspond to a one sample test.
import pandas as pd
extra_info_subjects = pd.DataFrame({'subject_label': subjects_label,
                                    'age': range(15, 15 + n_subjects),
                                    'sex': [0, 1] * int(n_subjects / 2)})
2.4.1.2. Create a second level design matrix
With that information we can create the second level design matrix.
from nistats.design_matrix import make_second_level_design_matrix
design_matrix = make_second_level_design_matrix(subjects_label, extra_info_subjects)
Out:
/home/kshitij/workspace/nistats-org/nistats-repo/nistats-kchawla-pi/nistats/design_matrix.py:460: UserWarning: Attention: Design matrix is singular. Aberrant estimates are expected.
  warn('Attention: Design matrix is singular. Aberrant estimates '
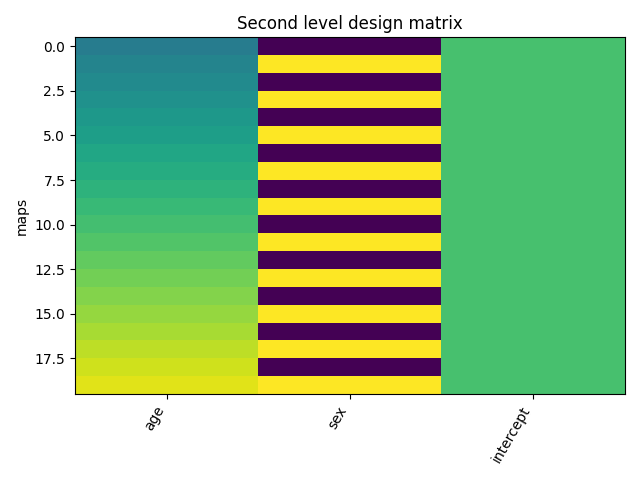
Let’s plot it.
from nistats.reporting import plot_design_matrix
ax = plot_design_matrix(design_matrix)
ax.set_title('Second level design matrix', fontsize=12)
ax.set_ylabel('maps')
plt.tight_layout()
plt.show()
Out:
/home/kshitij/workspace/nistats-org/nistats-repo/nistats-kchawla-pi/examples/04_low_level_functions/plot_second_level_design_matrix.py:50: UserWarning: Matplotlib is currently using agg, which is a non-GUI backend, so cannot show the figure.
  plt.show()
Total running time of the script: ( 0 minutes 0.144 seconds)