Note
This page is a reference documentation. It only explains the function signature, and not how to use it. Please refer to the user guide for the big picture.
3.11.2. nistats.reporting.plot_design_matrix
-
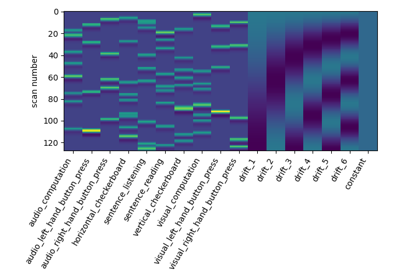
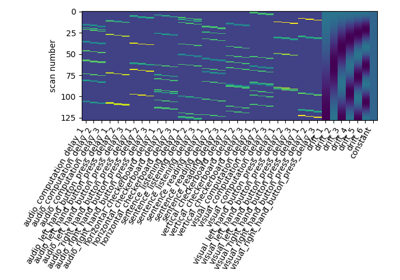
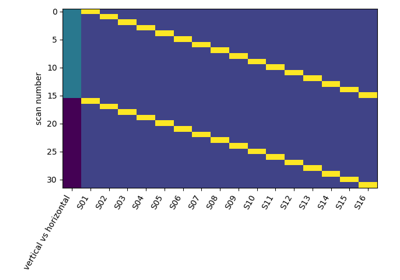
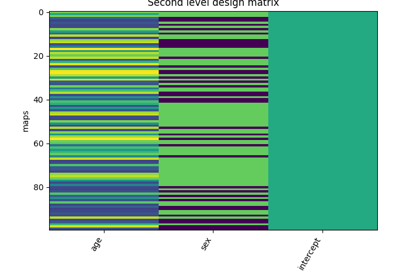
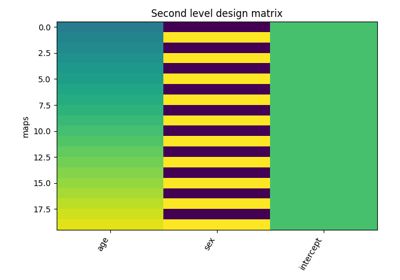
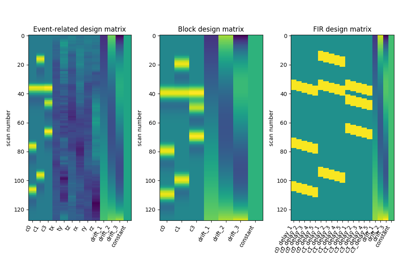
nistats.reporting.plot_design_matrix(design_matrix, rescale=True, ax=None, output_file=None)¶ Plot a design matrix provided as a DataFrame
- Parameters
- design matrixpandas DataFrame,
Describes a design matrix.
- rescalebool, optional
Rescale columns magnitude for visualization or not.
- axaxis handle, optional
Handle to axis onto which we will draw design matrix.
- output_file: string or None, optional,
The name of an image file to export the plot to. Valid extensions are .png, .pdf, .svg. If output_file is not None, the plot is saved to a file, and the display is closed.
- Returns
- ax: axis handle
The axis used for plotting.