Note
Click here to download the full example code
2.3.3. Statistical testing of a second-level analysis
Perform a one-sample t-test on a bunch of images (a.k.a. second-level analyis in fMRI) and threshold the resulting statistical map.
This example is based on the so-called localizer dataset. It shows activation related to a mental computation task, as opposed to narrative sentence reading/listening.
2.3.3.1. Prepare some images for a simple t test
This is a simple manually performed second level analysis.
from nilearn import datasets
n_samples = 20
localizer_dataset = datasets.fetch_localizer_calculation_task(
    n_subjects=n_samples)
Out:
/home/kshitij/miniconda3/envs/nistats-py36-latest/lib/python3.6/site-packages/numpy/lib/npyio.py:2372: VisibleDeprecationWarning: Reading unicode strings without specifying the encoding argument is deprecated. Set the encoding, use None for the system default.
  output = genfromtxt(fname, **kwargs)
Get the set of individual statstical maps (contrast estimates)
cmap_filenames = localizer_dataset.cmaps
2.3.3.2. Perform the second level analysis
First, we define a design matrix for the model. As the model is trivial (one-sample test), the design matrix is just one column with ones.
import pandas as pd
design_matrix = pd.DataFrame([1] * n_samples, columns=['intercept'])
Next, we specify and estimate the model.
from nistats.second_level_model import SecondLevelModel
second_level_model = SecondLevelModel().fit(
    cmap_filenames, design_matrix=design_matrix)
Compute the only possible contrast: the one-sample test. Since there is only one possible contrast, we don’t need to specify it in detail.
z_map = second_level_model.compute_contrast(output_type='z_score')
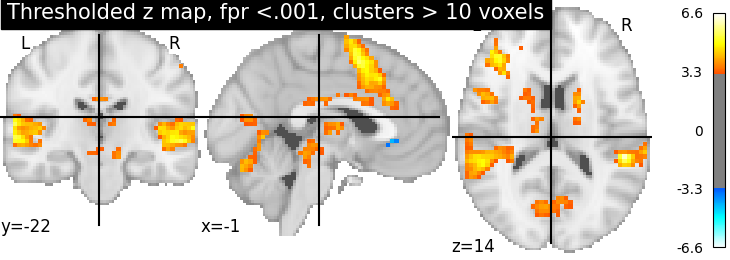
Threshold the resulting map: false positive rate < .001, cluster size > 10 voxels.
from nistats.thresholding import map_threshold
thresholded_map1, threshold1 = map_threshold(
    z_map, alpha=.001, height_control='fpr', cluster_threshold=10)
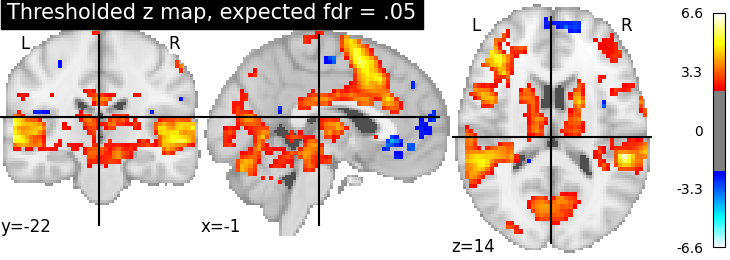
Now use FDR <.05 (False Discovery Rate) and no cluster-level threshold.
thresholded_map2, threshold2 = map_threshold(
    z_map, alpha=.05, height_control='fdr')
print('The FDR=.05 threshold is %.3g' % threshold2)
Out:
The FDR=.05 threshold is 2.37
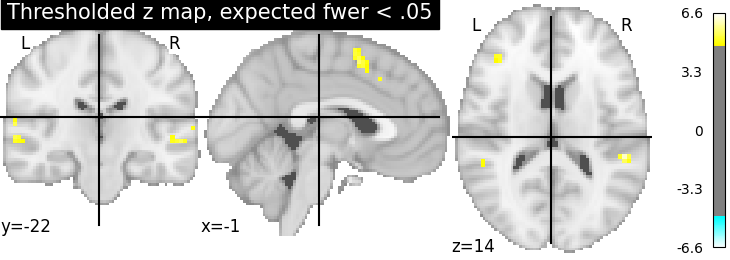
Now use FWER <.05 (Family-Wise Error Rate) and no cluster-level threshold. As the data has not been intensively smoothed, we can use a simple Bonferroni correction.
thresholded_map3, threshold3 = map_threshold(
    z_map, alpha=.05, height_control='bonferroni')
print('The p<.05 Bonferroni-corrected threshold is %.3g' % threshold3)
Out:
The p<.05 Bonferroni-corrected threshold is 4.88
2.3.3.3. Visualize the results
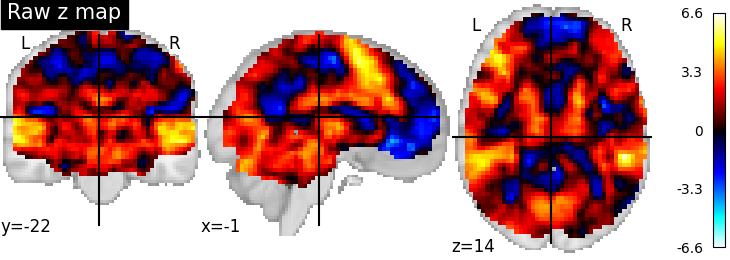
First, the unthresholded map.
from nilearn import plotting
display = plotting.plot_stat_map(z_map, title='Raw z map')
Second, the p<.001 uncorrected-thresholded map (with only clusters > 10 voxels).
plotting.plot_stat_map(
    thresholded_map1, cut_coords=display.cut_coords, threshold=threshold1,
    title='Thresholded z map, fpr <.001, clusters > 10 voxels')
Out:
<nilearn.plotting.displays.OrthoSlicer object at 0x7f6f14301dd8>
Third, the fdr-thresholded map.
plotting.plot_stat_map(thresholded_map2, cut_coords=display.cut_coords,
                       title='Thresholded z map, expected fdr = .05',
                       threshold=threshold2)
Out:
<nilearn.plotting.displays.OrthoSlicer object at 0x7f6ec33a0160>
Fourth, the Bonferroni-thresholded map.
plotting.plot_stat_map(thresholded_map3, cut_coords=display.cut_coords,
                       title='Thresholded z map, expected fwer < .05',
                       threshold=threshold3)
Out:
<nilearn.plotting.displays.OrthoSlicer object at 0x7f6f143bcf98>
These different thresholds correspond to different statistical guarantees: in the FWER-corrected image there is only a probability smaller than .05 of observing any false positive voxel. In the FDR-corrected image, 5% of the voxels found are likely to be false positive. In the uncorrected image, one expects a few tens of false positive voxels.
Total running time of the script: ( 0 minutes 3.315 seconds)