Note
Click here to download the full example code
2.3.1. Second-level fMRI model: true positive proportion in clusters
This script showcases the so-called “All resolution inference” procedure, in which the proportion of true discoveries in arbitrary clusters is estimated. The clusters can be defined from the input image, i.e. in a circular way, as the error control accounts for arbitrary cluster selection.
Rosenblatt JD, Finos L, Weeda WD, Solari A, Goeman JJ. All-Resolutions Inference for brain imaging. Neuroimage. 2018 Nov 1;181:786-796. doi: 10.1016/j.neuroimage.2018.07.060
2.3.1.1. Fetch dataset
We download a list of left vs right button press contrasts from a localizer dataset. Note that we fetch individual t-maps that represent the BOLD activity estimate divided by the uncertainty about this estimate.
from nilearn.datasets import fetch_localizer_contrasts
n_subjects = 16
data = fetch_localizer_contrasts(["left vs right button press"], n_subjects,
                                 get_tmaps=True)

from nilearn import plotting
import matplotlib.pyplot as plt
Out:
/home/kshitij/miniconda3/envs/nistats-py36-latest/lib/python3.6/site-packages/numpy/lib/npyio.py:2372: VisibleDeprecationWarning: Reading unicode strings without specifying the encoding argument is deprecated. Set the encoding, use None for the system default.
  output = genfromtxt(fname, **kwargs)
2.3.1.2. Estimate second level model
We define the input maps and the design matrix for the second level model and fit it.
import pandas as pd
second_level_input = data['cmaps']
design_matrix = pd.DataFrame([1] * len(second_level_input),
                             columns=['intercept'])
Model specification and fit
from nistats.second_level_model import SecondLevelModel
second_level_model = SecondLevelModel(smoothing_fwhm=8.0)
second_level_model = second_level_model.fit(second_level_input,
                                            design_matrix=design_matrix)
To estimate the contrast is very simple. We can just provide the column name of the design matrix.
z_map = second_level_model.compute_contrast(output_type='z_score')
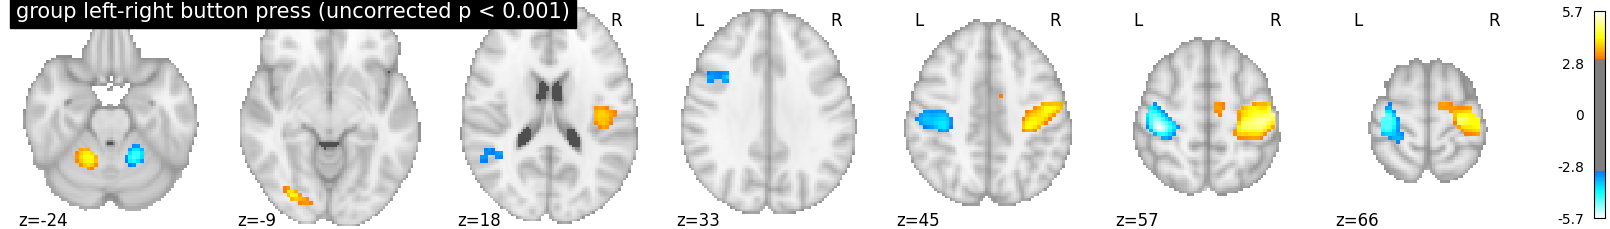
We threshold the second level contrast at uncorrected p < 0.001 and plot
from scipy.stats import norm
p_val = 0.001
p001_uncorrected = norm.isf(p_val)
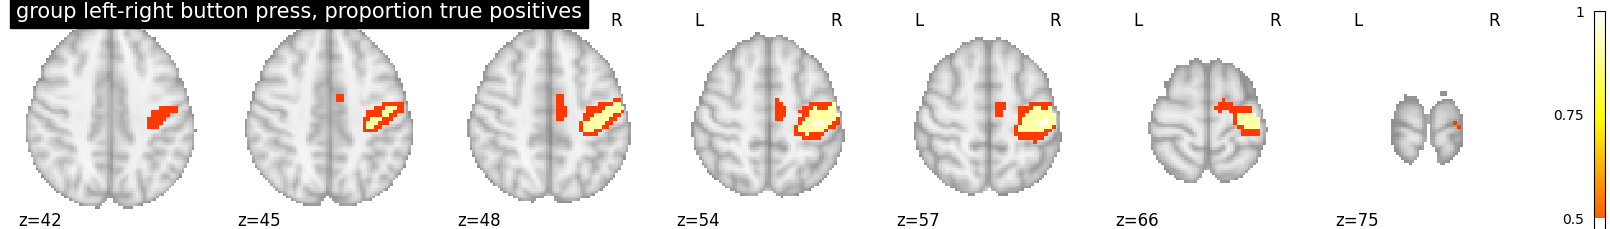
from nistats.thresholding import cluster_level_inference
proportion_true_discoveries_img = cluster_level_inference(z_map, threshold=[3, 4, 5], alpha=.05)
plotting.plot_stat_map(
proportion_true_discoveries_img, threshold=0., colorbar=True, display_mode='z',
title='group left-right button press, proportion true positives', vmax=1)
plotting.plot_stat_map(
z_map, threshold=p001_uncorrected, colorbar=True, display_mode='z',
title='group left-right button press (uncorrected p < 0.001)')
plotting.show()
Total running time of the script: ( 0 minutes 2.279 seconds)